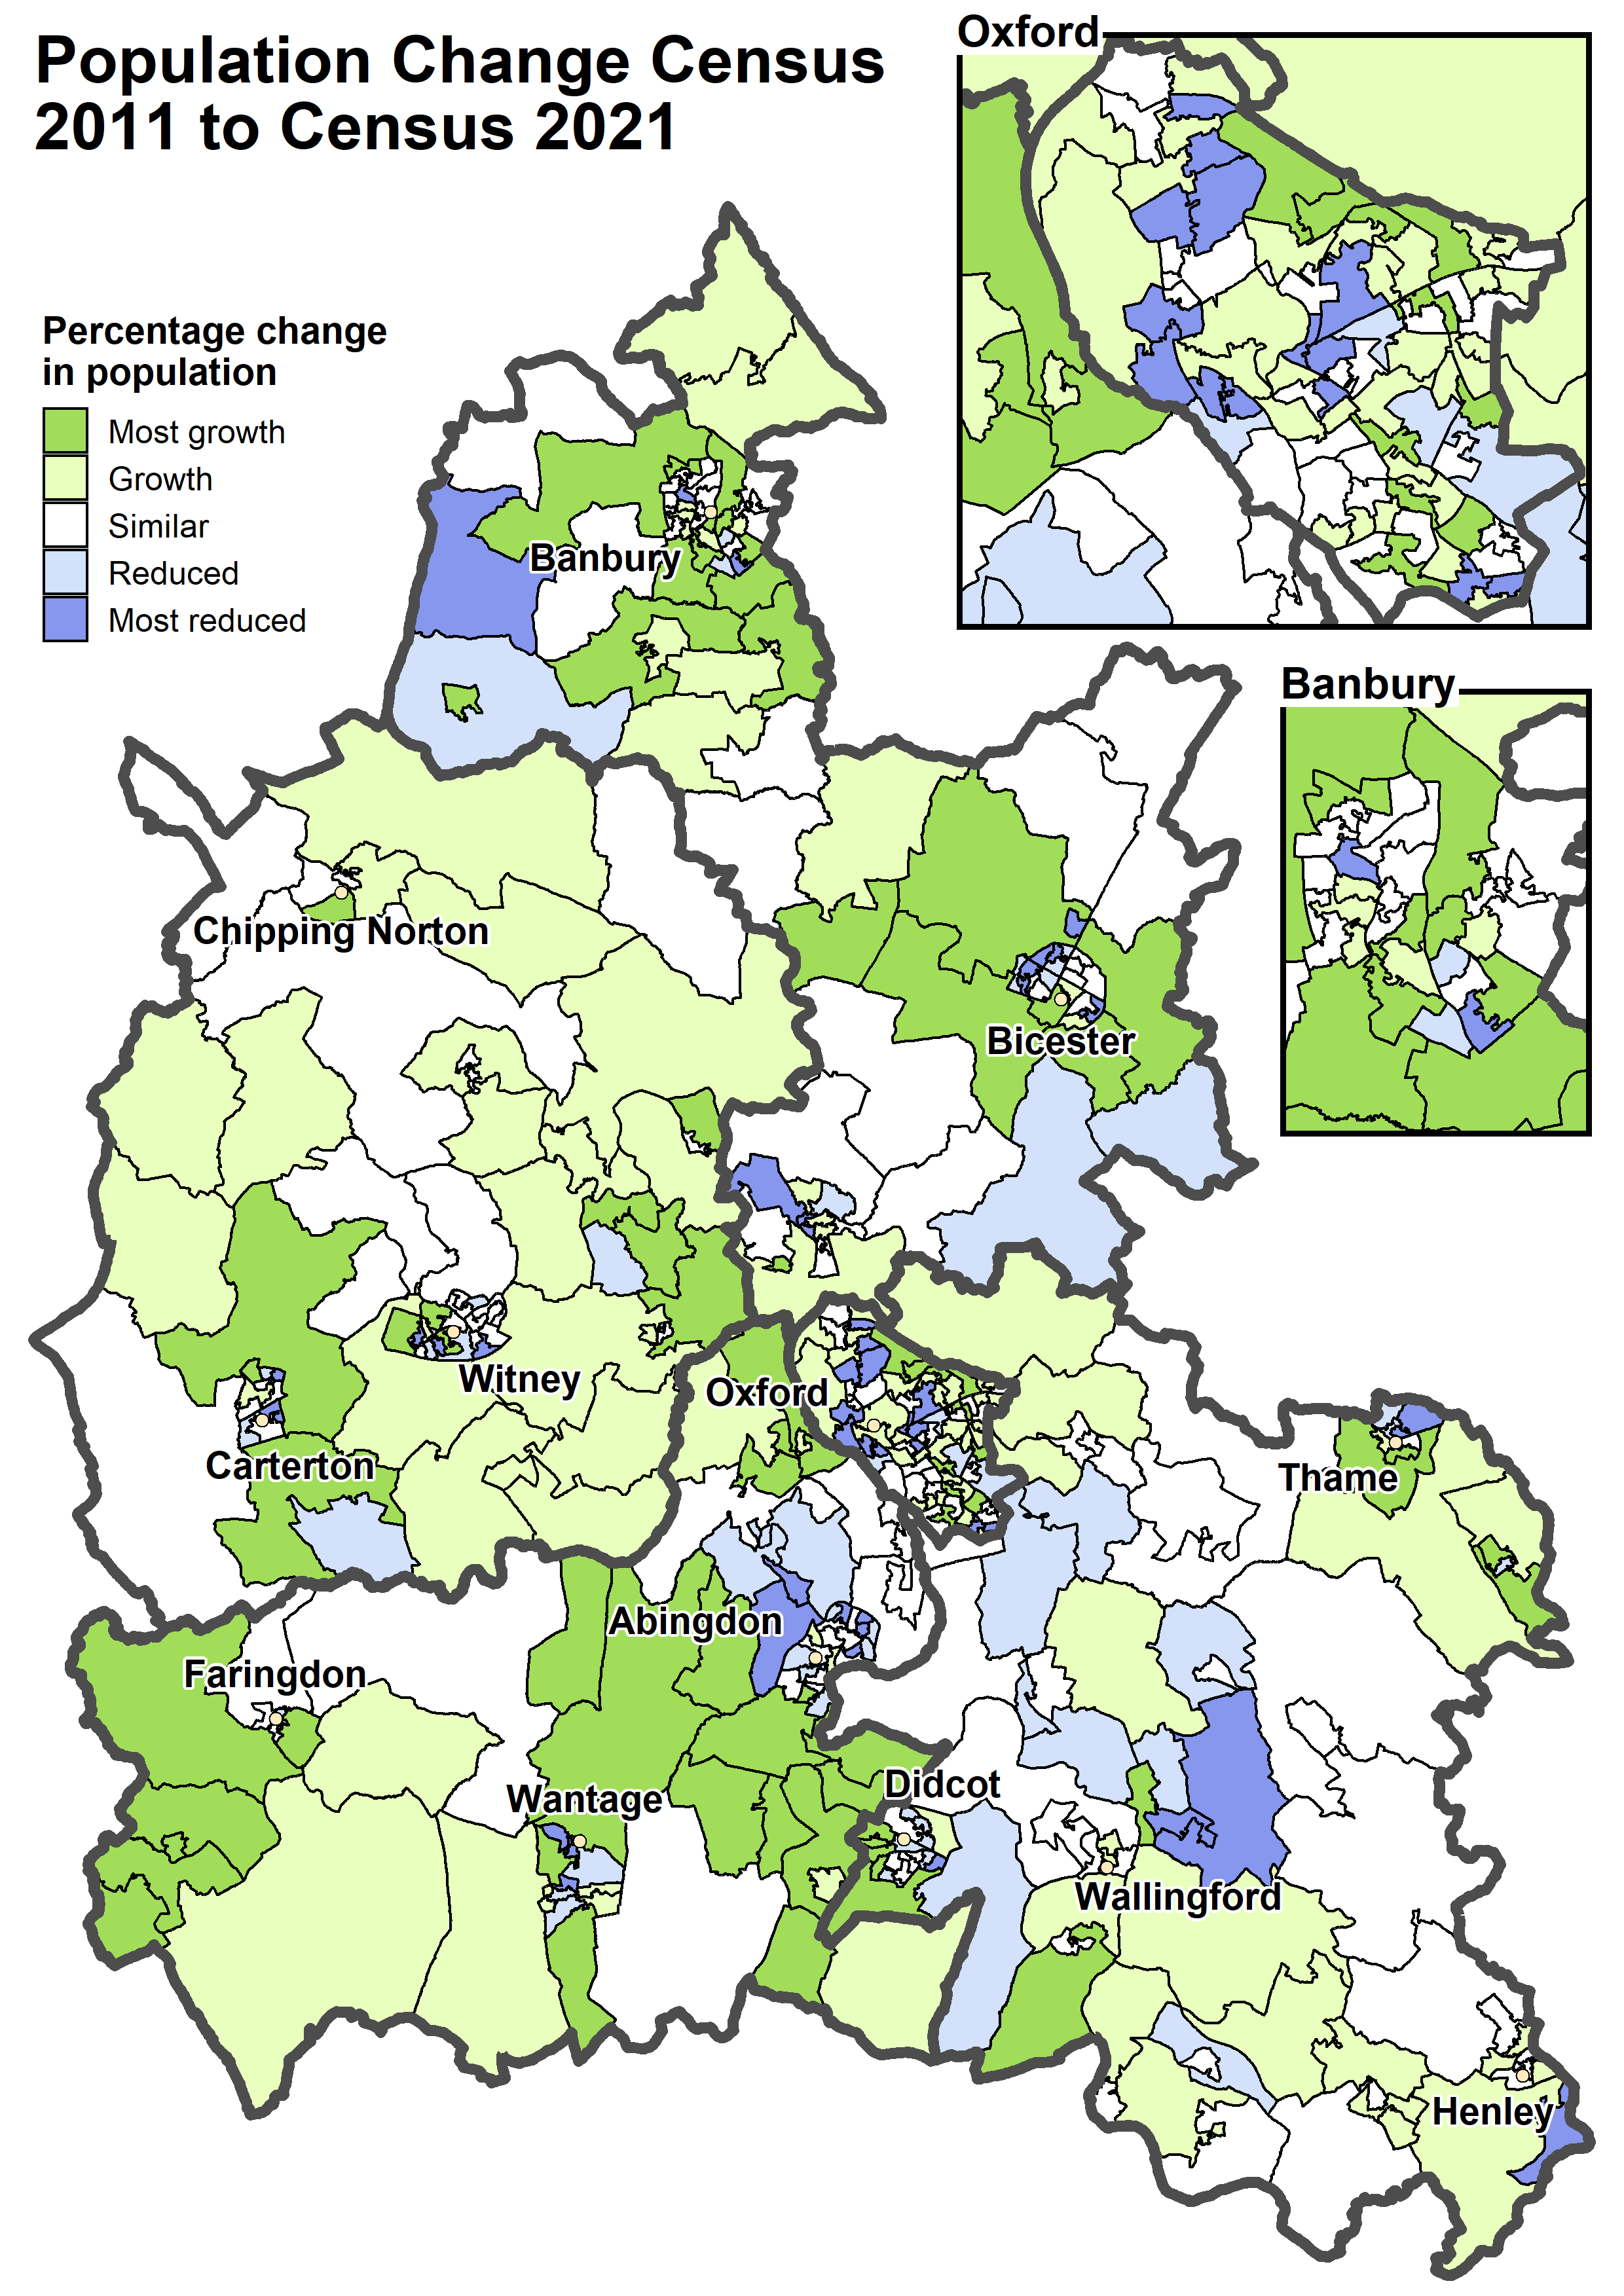
Small area population change - Census 2021
The pattern of population change varies across the county
In 2021 the population of Oxfordshire was 725,314, an increase of 71,516 (+11%) from 653,798 in 2011.
Census 2021 data is published for small areas called Lower Layer Super Output Areas (LSOAs) each with around 1,600 residents.
Between 2011 and 2021 the areas of Oxfordshire with the greatest population increases were:
- Chesterton LSOA increased by 243%
- Hagbourne LSOA increased by 231%
- Harwell LSOA increased by 191%
The areas of Oxfordshire where the population has declined the most were:
- Carterton South LSOA reduced 40%
- Headington Hill LSOA reduced by 19%
- Osney LSOA reduced by 18%
Note: With the release of the most recent census, some of our small area boundries have changed.
Our map below shows which areas of our county have increased or reducedin population in the last 10 years. Blue areas have reduced in population, Green areas are those that have increased, and white has remained the same.

Note: Most Reduced (more than -5%), Reduced (more than -2%), Similar (between -2% and +5%), Growth (more than +5%), Most Growth (more than +20%).
Source: ONS Census 2021 TS001
Finding out more
- View the ONS Census 2021 population and household article
- Explore the ONS Census 2021 interactive map
- Explore the NOMIS Census 2021 data query tool
- Explore the underlying data in the ONS Census 2021 demography and migration tables (published 2 Nov 2022)
Further Census articles can be found on the Census 2021 page of Oxfordshire Insight
Further population articles and information can be found on the population page of Oxfordshire Insight
Contact jsna@oxfordshire.gov.uk
