
Future population
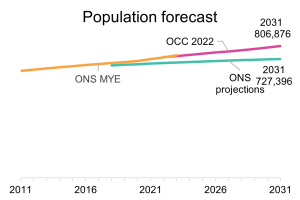
There are two alternative sources of data for the future change in population:
- Oxfordshire County Council’s housing-led forecasts which incorporate district council plans for house building
- ONS projections based on past trends.
See summary of the latest Oxfordshire housing-led forecasts (August 2024)
EXPLORE housing-led forecasts using our interactive dashboard
- Oxfordshire County Council housing-led forecasts (August 2024)
DOWNLOAD a bitesize report and the dataset
- JSNA Bitesize on future population growth (August 2024)
- Excel spreadsheet with OCC housing-led forecasts by local authority district and MSOA (including methodology, August 2024)
FURTHER INFORMATION is available from
- Our Guide to Geography with information on geographical areas used for publishing statistics
- ONS population estimates and projections for districts and small areas on nomis
- ONS 2018-based projections (based on past trends) released March 2020
The below table summarises when you would use the two different models
|
|
ONS Projections |
Oxfordshire County Council Forecasts |
|
Geographies available |
Districts, counties and national |
Oxfordshire MSOAs (small areas), districts and county |
|
Time period |
25 years |
10 years (limited by new housing feed) |
|
New housing |
Implicitly included via historical migration figures, which partly include house-building |
Explicitly includes population change arising from new house building in the Local Plans |
|
Base Population |
Latest ONS mid-year estimate (MYE) |
Latest ONS mid-year estimate (MYE) |
|
Uses |
To compare with areas outside Oxfordshire. For returns to central government where standardized figures are required. |
To understand local growth and service needs. To examine population change at smaller areas (MSOAs). |
PREVIOUS PUBLICATIONS
- Oxfordshire County Council housing-led forecasts (released March 2023)
- Oxfordshire County Council housing-led forecasts (released Feburary 2022)
- Oxfordshire County Council housing-led forecasts (released June 2021)
- Oxfordshire County Council housing-led forecasts (released September 2020)
- Oxfordshire County Council housing-led forecasts (released August 2019)