
Census 2021 results highlight Oxfordshire’s growing population
The Office of National Statistics (ONS) has released the first results from the 2021 Census providing data at Local Authority level only, including population counts by 5-year age band and count of households. All data has been provided rounded to the nearest 100 and may not sum.
More detailed Census 2021 data for small areas and on topics such as ethnicity, health and the labour market are due to be released by ONS from October 2022.
Above-average increase in Oxfordshire’s population
On Census Day, 21 March 2021, the size of the usual resident population in Oxfordshire was 725,300.
Oxfordshire’s population grew by 71,500 (10.9%) since the last Census in 2011 when it was 653,800. This increase in Oxfordshire was above the growth across England (6.6%).
Each district in the county has seen an increase, with the greatest change in Cherwell and Vale of White Horse.
| Population | Census 2011 | Census 2021 | 2011 to 2021 | Percentage change |
| Cherwell | 141,900 | 161,000 | 19,100 | 13.5% |
| Oxford | 151,900 | 162,100 | 10,200 | 6.7% |
| South Oxfordshire | 134,300 | 149,100 | 14,800 | 11.1% |
| Vale of White Horse | 121,000 | 138,900 | 17,900 | 14.8% |
| West Oxfordshire | 104,800 | 114,200 | 9,400 | 9.0% |
| Oxfordshire | 653,800 | 725,300 | 71,500 | 10.9% |
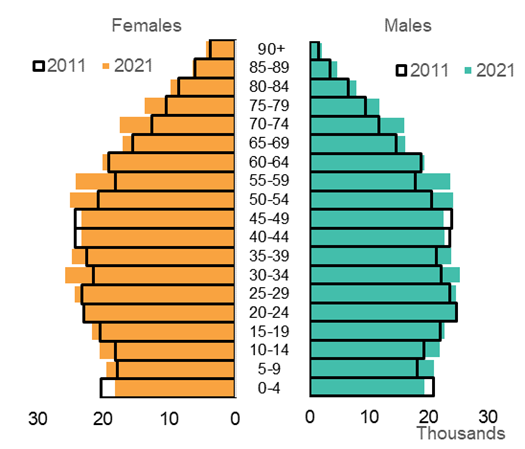
Increases in the working age and older population
Between 2011 and 2021, Oxfordshire saw significant increases in the resident population of:
- Young people aged 5 to 14 (+15%)
- Working aged people in their 30s (+15%) and 50s (+27%)
- Older people aged 65+ (+25%)
There has been a fall in the number of children aged 0-4 (-8%). This decline in the number of young children was most significant in Oxford City.
Increase in households
The number of households has increased in Oxfordshire, with an increase in each district with the exception of Oxford City, which has seen a small decline.
| Households | Census 2011 | Census 2021 | 2011 to 2021 | Percentage change |
| Cherwell | 56,700 | 65,900 | 9,200 | 16.2% |
| Oxford | 55,400 | 55,200 | -200 | -0.3% |
| South Oxfordshire | 54,100 | 61,500 | 7,400 | 13.7% |
| Vale of White Horse | 49,400 | 57,500 | 8,100 | 16.4% |
| West Oxfordshire | 43,200 | 48,000 | 4,800 | 11.0% |
| Oxfordshire | 258,900 | 288,100 | 29,200 | 11.3% |
Households are those with at least one usual resident.
Finding out more
- Find the latest population estimates and forecasts, including the Census results, on the population page of Oxfordshire Insight
- Explore the Census 2021 first results from ONS including some fun scrollytelling for Cherwell, Oxford, South Oxfordshire, Vale of White Horse and West Oxfordshire
- From October 2022, watch out for more information on Census 2021 results on Oxfordshire Insight.
Contact jsna@oxfordshire.gov.uk