
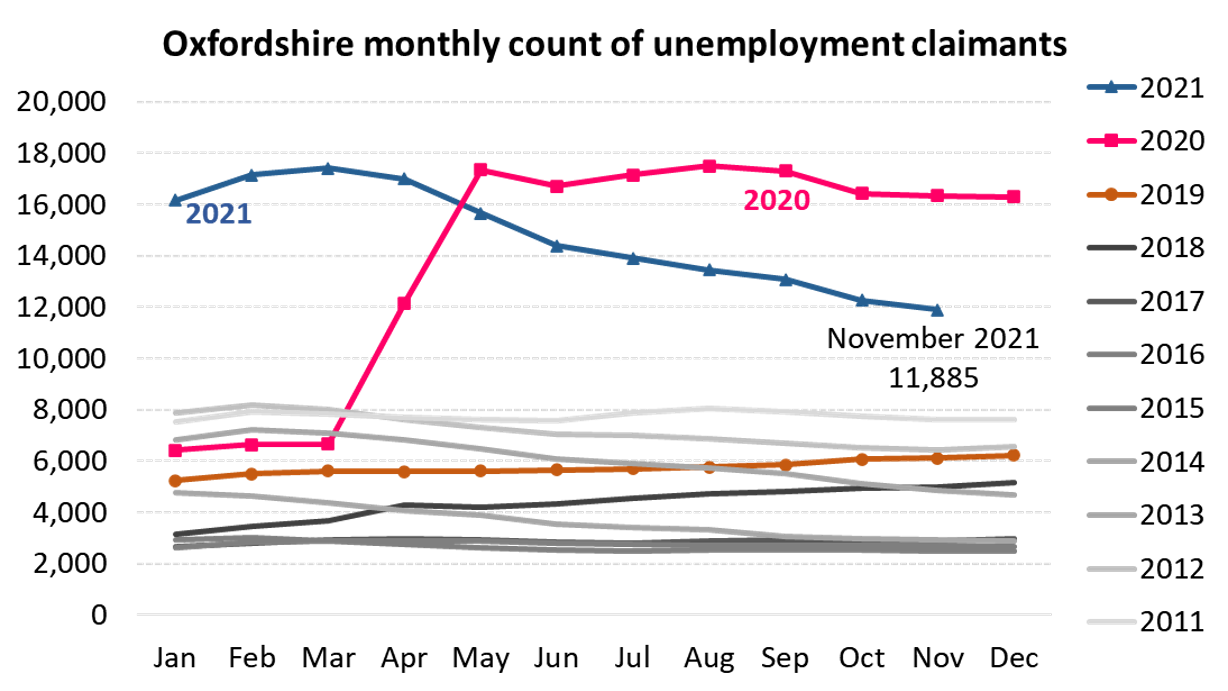
Unemployment claimants to November 2021
Unemployment claimant count data (released 14 December 2021 by the Department of Work and Pensions) shows that the number of people claiming unemployment-related benefits in Oxfordshire decreased between October and November 2021, from 12,275 to 11,885 (-3.2%).
By district in November 2021, the rate of unemployment claimants (as a percentage of the economically active population aged 16-64) was highest in Oxford City followed by Cherwell. By age group, the rate was highest in Oxfordshire (and England) for claimants aged 16-24.
Change in unemployment claimants Nov-20 to Nov-21
| Nov 2020 | Nov 2021 | Nov 2020 to Nov 2021 | |||
| count | rate* | count | rate* | ppt change | |
| Cherwell | 3,790 | 4.9% | 2,740 | 3.6% | -1.37 |
| Oxford | 4,600 | 6.6% | 3,575 | 5.1% | -1.47 |
| South Oxfordshire | 2,865 | 4.0% | 1,995 | 2.8% | -1.22 |
| Vale of White Horse | 2,740 | 4.0% | 1,925 | 2.8% | -1.18 |
| West Oxfordshire | 2,355 | 4.2% | 1,650 | 2.9% | -1.25 |
| Oxfordshire | 16,345 | 4.8% | 11,885 | 3.5% | -1.30 |
| England | 2,225,600 | 8.2% | 1,650,840 | 6.1% | -2.12 |
Unemployment claimants by age group Nov-21
| 16-24 | 25-49 | 50+ | ||||
| count | rate* | count | rate* | count | rate* | |
| Cherwell | 465 | 5.0% | 1,650 | 3.8% | 625 | 2.7% |
| Oxford | 520 | 4.0% | 2,155 | 5.5% | 900 | 5.6% |
| South Oxfordshire | 290 | 3.4% | 1,155 | 3.0% | 550 | 2.4% |
| Vale of White Horse | 310 | 3.6% | 1,145 | 2.9% | 475 | 2.2% |
| West Oxfordshire | 275 | 3.9% | 965 | 4.3% | 410 | 2.2% |
| Oxfordshire | 1,860 | 4.0% | 7,065 | 3.7% | 2,955 | 2.9% |
| England | 273,795 | 7.3% | 974,135 | 6.2% | 402,885 | 5.3% |
*per the economically active population (calculated as the ONS mid-2020 population estimate - aged 16-64 for the top table - multiplied by the proportion of the population that are economically active, as recorded by the 2011 Census); ppt=percentage point
Explore the latest unemployment data for Oxfordshire using our interactive dashboard.
Data downloaded from www.nomisweb.co.uk (14 December 2021)