
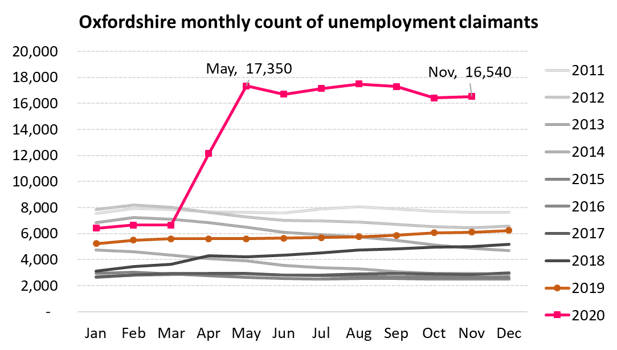
Unemployment claimants to November 2020
Unemployment claimant count data (released 15 December 2020 by the Department of Work and Pensions) shows the number of people claiming unemployment-related benefits in Oxfordshire increased slightly between October 2020 and November 2020, from 16,420 to 16,540 (+1%).
Change in unemployment claimants Nov-19 to Nov-20
| Nov-19 | Nov-20 | Nov-19 to Nov-20 | |||
| count | rate* | count | rate* | ppt change | |
| Cherwell | 1,280 | 1.4% | 3,825 | 4.1% | 2.74 |
| Oxford | 1,995 | 1.9% | 4,660 | 4.4% | 2.51 |
| South Oxfordshire | 985 | 1.2% | 2,910 | 3.4% | 2.27 |
| Vale of White Horse | 1,020 | 1.2% | 2,755 | 3.3% | 2.11 |
| West Oxfordshire | 830 | 1.3% | 2,390 | 3.6% | 2.36 |
| Oxfordshire | 6,110 | 1.4% | 16,540 | 3.8% | 2.41 |
| England | 998,185 | 2.8% | 2,248,430 | 6.4% | 3.56 |
*per population aged 16-64 (ONS mid-2019); ppt=percentage point
Note that this does not include people on the Coronavirus Job Retention scheme, which is due to finish at the end of March 2021 (with a review in January 2021). As of 30 September 2020, there were 24,100 furloughed employments in Oxfordshire, a take-up of 7% compared with 8% take-up across England.
Explore the latest unemployment data for Oxfordshire using our interactive dashboard.
Data downloaded from www.nomisweb.co.uk (15 December 2020); Furlough data from HMRC