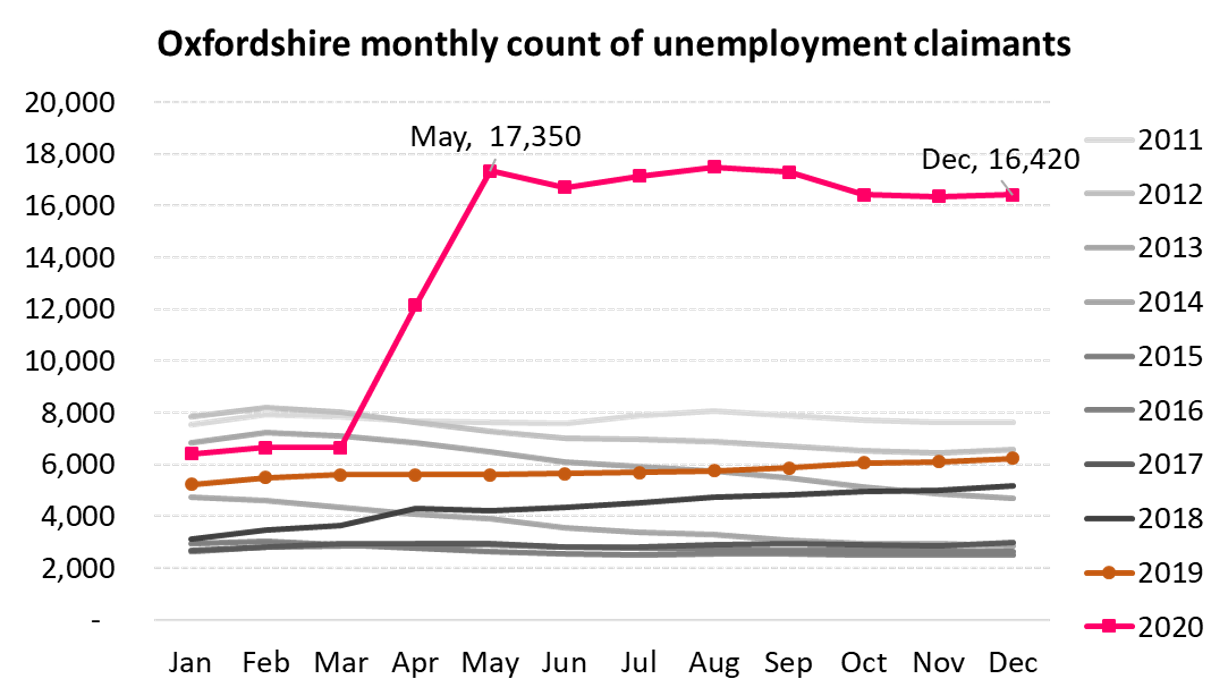
Unemployment claimants to December 2020
Unemployment claimant count data (released 26 January 2021) by the Department of Work and Pensions) shows the number of people claiming unemployment-related benefits in Oxfordshire increased slightly between November 2020 and December 2020, from 16,345 to 16,640 (+0.5%).

Change in unemployment claimants Dec-19 to Dec-20
| Dec-19 | Dec-20 | Dec-19 to Dec-20 | |||
| count | rate* | count | rate* | ppt change | |
| Cherwell | 1,275 | 1.4% | 3,775 | 4.1% | 2.69 |
| Oxford | 2,040 | 1.9% | 4,705 | 4.4% | 2.51 |
| South Oxfordshire | 1,010 | 1.2% | 2,890 | 3.4% | 2.22 |
| Vale of White Horse | 1,030 | 1.3% | 2,755 | 3.3% | 2.02 |
| West Oxfordshire | 875 | 1.3% | 2,695 | 3.6% | 2.25 |
| Oxfordshire | 6,230 | 1.4% | 16,420 | 3.8% | 2.36 |
| England | 1,003,150 | 2.9% | 2,234,335 | 6.4% | 3.51 |
Unemployment claimants by age group Dec-20
| 16-24 | 25-49 | 50+ | ||||
| count | rate* | count | rate* | count | rate* | |
| Cherwell | 725 | 5.6% | 2,185 | 4.4% | 865 | 2.9% |
| Oxford | 855 | 2.4% | 2,785 | 5.6% | 1,060 | 5.0% |
| South Oxfordshire | 515 | 4.3% | 1,550 | 3.6% | 820 | 2.8% |
| Vale of White Horse | 490 | 4.1% | 1,535 | 3.5% | 665 | 2.5% |
| West Oxfordshire | 465 | 5.0% | 1,310 | 5.7% | 585 | 2.6% |
| Oxfordshire | 3,050 | 3.7% | 9,370 | 4.3% | 4,000 | 3.1% |
| England | 429,185 | 7.2% | 1,273,055 | 6.9% | 532,030 | 5.0% |
*per population aged 16-64 (ONS mid-2019); ppt=percentage point
Note that this does not include people on the Coronavirus Job Retention scheme, which is due to finish at the end of April 2021. As of 31 October 2020, there were 21,400 furloughed employments in Oxfordshire, a take-up of 6% compared with 7% take-up across England.
Explore the latest unemployment data for Oxfordshire using our interactive dashboard.
Data downloaded from www.nomisweb.co.uk (26 January 2020); Furlough data from HMRC
